facebook

BCG Growth – Share Matrix

Posted by SMstudy® on April 08, 2021 | Marketing Research (MR)

Keywords: BCG, BCG Matrix, BCG Growth Matrix

BCG Growth – Share Matrix

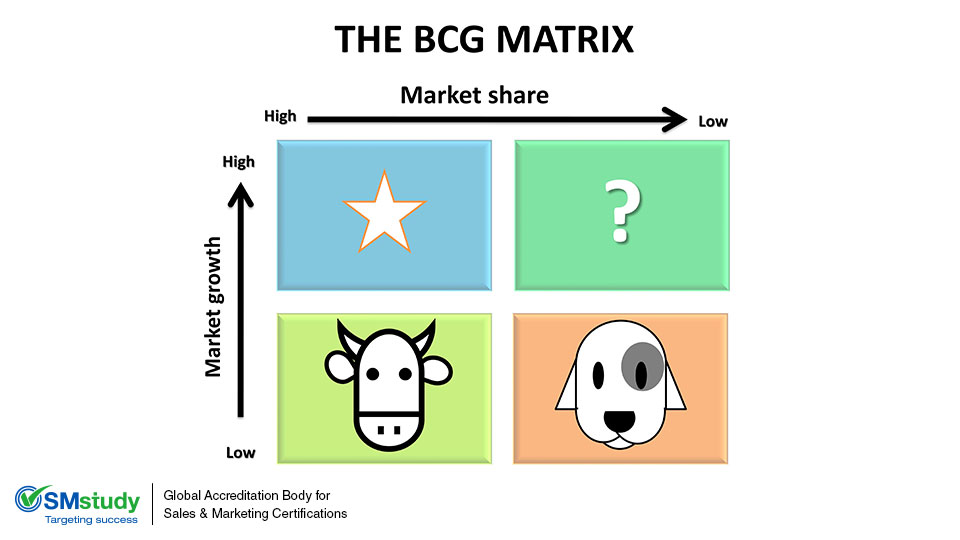
The concept of Growth–Share Matrix was created by Bruce D Henderson for the Boston Consulting Group (BCG). It later came to be known as BCG growth-share matrix. During the late 1960’s this model was conceptualized to evaluate the potential of a product portfolio along with its strategic position in the business.

In the BCG growth–share matrix is one of the most sought after models to assess the strengths and weaknesses of the product portfolio of an organization. This matrix helps the organization to take corrective actions at proper time and frame strategies to increase profitability from each product in a particular portfolio.

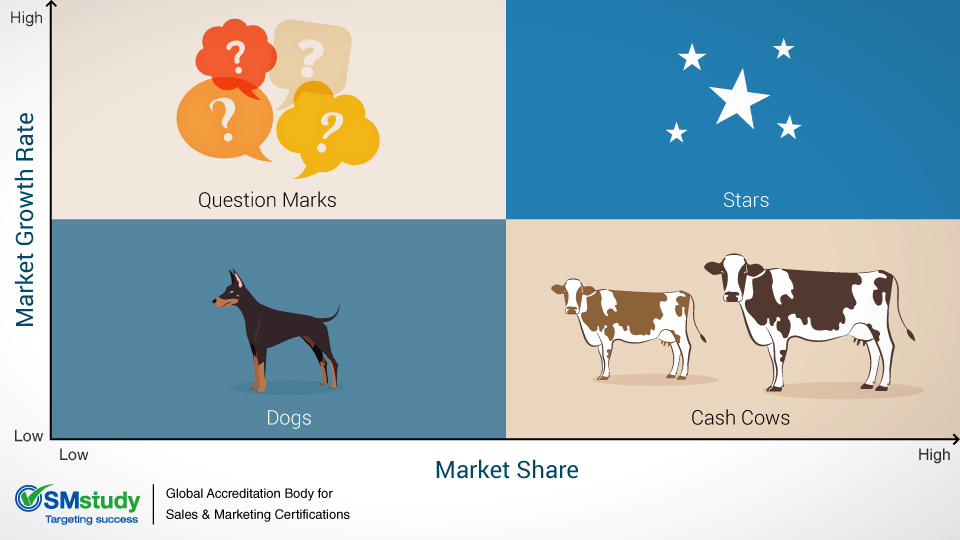
In this matrix, vertical axis shows the market growth rate and horizontal axis represents the market share. The matrix divides each product from a product portfolio into the following four categories:

1. Cash Cows:

These are highly profitable products of a company. As these products have high demand and market share. They act as a great source of cash flow for an organization. The market share for cash cows should be monitored closely to ensure they do not move from the category of cash cow to the category of products classified as “Dogs.”


2. Stars:

As the name suggests, these are the star products of a company with high market share and high growth rate. These products lead the emerging markets. Although they are a great source of cash flow, the company needs to invest a lot in creating such products and carrying out its associated business and marketing operations. When the growth rate of such products lowers, they usually fall in the category of “Cash Cows” and help the company sustain the market share.


3. Dogs:

These product categories have very low market share in stagnant or declining markets, thereby generating low or no cash returns. Investments on such products are not recommended because they do not bring any remarkable benefits to the company. They may be utilized as a loss leader to gain the attention of new customers.


4. Question Marks:

These are the products with low market share but a high growth rate. The direction of such products cannot be predicted. If they continue with the high growth rate, they can become “Stars” over a period of time. And as the growth rate slows down, they may become “Cash Cows.” However, if these products continue to have a low market share, then over a period of time, as the market starts declining, these may fall in the category of “Dogs.” Hence, this product category is a question mark for an organization. These products cannot be left as it is though; at some point of time, the Management has to decide whether to invest in such products or not.

So, this matrix is used to evaluate the degree of appeal of every business unit and help the organization decide the appropriate amount of investment required in each product.

Download Free Digital Marketing Guide Free Digital Marketing Certification Course

BCG Growth-Share Matrix: Tool to Determine Internal Strengths and Weaknesses of a Company

Posted by SMstudy® on November 09, 2015 | Marketing Strategy (MS)

Keywords: BCG, BCG Matrix, Strength and Weaknesses, product strategy, corporate strategy

BCG Growth-Share Matrix: Tool to Determine Internal Strengths  and Weaknesses of a Company

Determining internal organizational capabilities is an integral part of a companys market opportunity analysis. It helps explain whether a company can afford to create a successful product or brand.


In the late 1960s, Bruce Henderson of the Boston Consulting Group (BCG) conceptualized the BCG Growth-Share Matrix to evaluate various business units of a company on the basis of their relative performance in a particular target market. However, the matrix can be equally applied to evaluate the various products or services offered by a company.


This tool is a two-by-two matrix containing four quadrants, with the vertical axis depicting market growth rate and the horizontal axis representing market share. It provides a way to determine the appeal of each business unit, product or service, which in turn can be used to determine the amount of investment, if any, that should be made in each product.


BCG Growth-Share Matrix classifies products into four categories: Cash Cows, Stars, Dogs and Question Marks. The Cash Cows and Stars are the strengths of the company, while the Dogs are generally weaknesses.


Cash Cows:

These products have high market share but low growth rates. The commanding position of Cash Cows ensures a continuous source of cash flow for the company.


Stars:

These products have high market share in markets and high growth rates. They are typically market leaders in new and emerging markets. To ensure that products considered as Stars continue to generate profits, a high amount of investment is required.


Dogs:

These products have low market share in stagnant or declining markets. However, they can be profitable for a company by being loss leaders for a particular market or product segment. In case there are no such benefits involved, it is better for a company to discontinue products in the Dogs category.


Question Marks:??

As the name suggests, this product category poses a question mark for management because, at some point, a decision has to be made on whether to invest in the product or phase it out. Question marks are present in markets with high growth rates but low market share.


For example, a leading electronics company can categorize its products as follows:


Cash Cows: Laptops that have high market share but low growth rate


Stars: Smartphones and tablets with high growth rate and high market share


Dogs: Music players and desktop computers with a low or declining market share


Question Marks: Television sets that have a low market share but have the potential to achieve high market share in the future with some investment


Download Free Digital Marketing Guide Free Digital Marketing Certification Course